What Is the Virality K Factor and Why It Matters
Many founders obsessively track downloads, follower counts, and sign-up numbers. What they often ignore is the one metric that tells you whether a product spreads on its own or slowly bleeds out without constant paid attention. That metric is the viral coefficient, sometimes called the virality K factor, and it separates products that market themselves from products that need you to keep feeding the acquisition machine.
Understanding this number is not about chasing some mythical viral moment. It is about having a clear, calculable view of whether your growth loop is working, which input to fix when it is not, and how to set realistic targets based on what products like yours actually achieve. At CasualMBA, this is exactly the kind of practical growth framework we break down every week for founders and builders who want to think clearly about how businesses scale.
This article covers what the K-factor formula means, how to calculate it with a formula you can use today, what benchmarks actually look like by product type, and how to move the number in the right direction without guessing.
What the virality K factor actually means
At its core, the viral coefficient measures how many new users each existing user generates. Frame it simply: if every user you acquire brings in 0.5 more users, your product has some virality but still depends on outside acquisition to stay alive. If every user brings in more than one new user, the product can grow on its own. That second scenario is what founders are chasing when they talk about building a product that markets itself.
A related concept worth distinguishing is the viral loop, the repeating cycle of users inviting others who then invite more. The virality K factor is the size of that loop: how many new users one user creates on average. Viral cycle time is the speed of the loop: how quickly that creation actually happens. Both matter, but K factor is where you start, because it tells you whether a meaningful loop exists at all. A product can have a fast cycle time but a K below 1, which means it still loses momentum over time rather than compounding.
The K-factor formula and how to calculate it
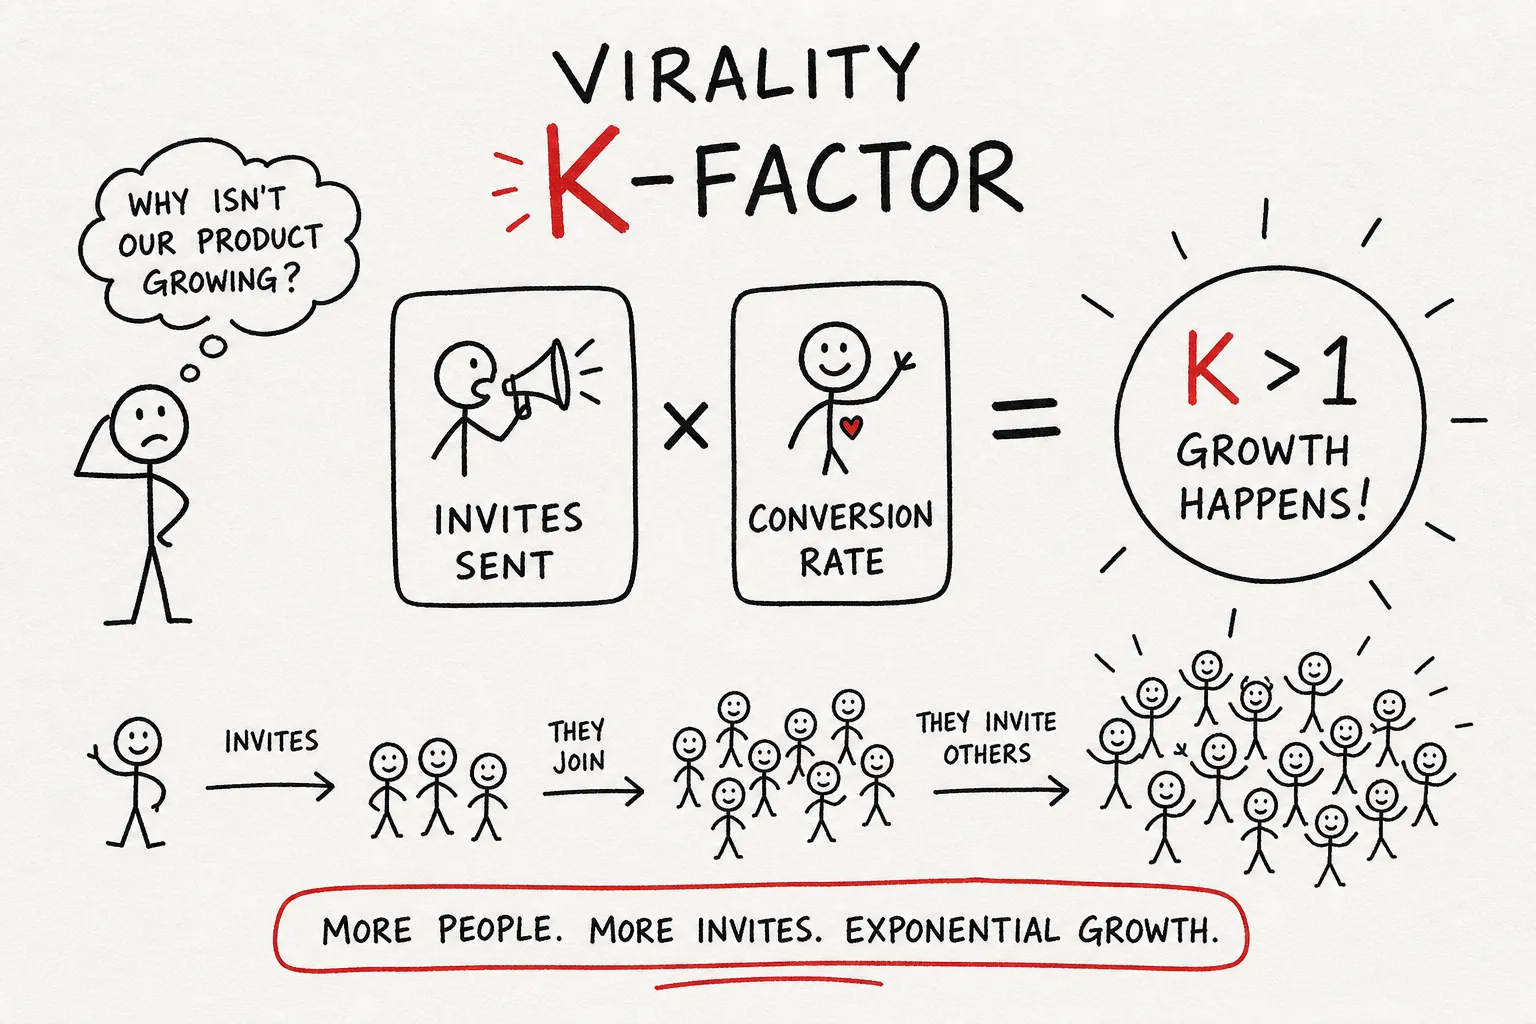
The calculation comes down to two inputs multiplied together. The first is your invites-per-user rate: the average number of invitations or referrals each user sends out in a given period. The second is your invite conversion rate: the percentage of those invitations that result in a new user actually joining. Multiply those two numbers and you have your virality K factor. If your average user sends five invites and 20% of invitees sign up, K = 5 × 0.20 = 1.0. That is the break-even point. If you’d like to compute your number directly from your own inputs, try a viral coefficient calculator.
Here is a more realistic scenario to make this concrete. You run a productivity app. The average user sends three invites per month, and 15% of those convert. K = 3 × 0.15 = 0.45. That number is not viral, but it is measurable, and now you know exactly which input to improve. To pull these numbers from your product analytics, track two events: an “invitation sent” event and an “invitation accepted” or “signed up via invite” event. Keep the denominator consistent by measuring only users who were eligible to send invites during the period, active users in the window, for example, rather than your full registered base, and choose a fixed time window (weekly or monthly) before you start so the numbers are comparable over time. For a clear explainer on the underlying math and examples, see this viral coefficient guide.
Using the virality K factor in your analytics
Once you have both events instrumented, this virality metric becomes one of the most actionable numbers in your dashboard. Unlike download counts or follower totals, every component of the K-factor formula points directly at something you can change: the invitation flow, the reward structure, the messaging, or the timing of the prompt. That specificity is what makes it worth tracking from day one.
Why a K above 1 is the milestone that changes everything
When K exceeds 1, each generation of users creates more users than the previous one. Growth compounds without requiring proportional increases in acquisition spend. When K stays below 1, growth still happens, but it decays across each generation and always needs an external push to sustain momentum. A simple generational model makes this tangible: start with 100 users and a K of 1.2. Generation two produces 120 users. Generation three produces 144. The product is growing from within, and you did not pay for any of those users.
The realistic benchmarks by product type are worth knowing before you decide what to aim for. For B2B SaaS, a K around 0.1 to 0.3 is considered solid, with 0.5 being genuinely strong. For consumer products, 0.15 to 0.25 is good, 0.4 is great, and 0.7 is outstanding. (Note that benchmarks vary meaningfully depending on your measurement window and how you define your eligible user cohort, so treat these as directional rather than definitive.) K above 1 is rare and usually short-lived even for breakout products. The goal for most founders is not to hit K = 1 immediately but to know their current number and move it consistently upward. A product with K = 0.3 that improves every quarter is in a stronger position than one stuck at 0.8 with no clear lever to pull. If you’re focused on SaaS specifically, this piece on K-factor for SaaS companies is a useful reference.
Companies that have actually been there
Dropbox is the most cited example of K-factor-driven growth for a reason. The company built a double-sided referral mechanic where both the referrer and the new user received extra storage space. That program pushed Dropbox from 100,000 to 4,000,000 users in roughly 15 months, a figure Drew Houston discussed publicly and that has been widely cited in growth marketing literature. The reward was product-native: more storage aligned directly with why people used Dropbox in the first place. Analysts who have studied the program suggest that this alignment between reward and product utility is one plausible reason the invite conversion rate held up at scale rather than degrading as the program matured, though the precise causal weight is difficult to isolate.
WhatsApp represents a different model entirely: virality baked into the core mechanic rather than layered on top through a referral program. To get value from WhatsApp, you needed people you already knew to also use it. That made every user a natural recruiter, not because they were incentivized to invite others, but because the product only worked if their contacts were there too. This structural virality, driven by network effects, is fundamentally different from incentive-based referral programs. Slack’s K factor reportedly reached exceptionally high levels at launch, a figure tied closely to early-adopter momentum rather than a steady-state number anyone maintained over time.
What K factor won’t tell you on its own
The most common mistake founders make is optimizing K factor while ignoring retention. A product can look viral on paper while losing users faster than it gains them. If invited users churn within two weeks, the viral loop breaks regardless of how high the invite conversion rate climbs. K factor measures the size of the inflow; retention determines whether that inflow actually builds anything lasting. Paid acquisition spikes can also inflate K temporarily, paid-driven users tend to refer at different rates than organic ones, making organic virality look stronger than it really is and giving you a false read on your actual growth health. Segmenting paid-driven invites from organic invites when you run your K calculation is worth the extra instrumentation effort.
Several other metrics pair with K factor to give a complete growth picture. Retention shows whether users come back after the first session or first week. Viral cycle time measures how quickly one user generates another, which affects how fast a given K factor actually compounds in calendar time. And LTV tells you whether the growth is economically worth sustaining at all. A founder tracking all four has a real growth dashboard. One tracking only the virality metric is reading a single instrument when the full picture needs at least four. The numbers only tell a coherent story together.
Practical moves to push your K factor higher
Increase invites per user
On the invites-per-user side, reward structure is the highest-leverage variable. Dual-sided programs, where both the referrer and the new user receive something meaningful, consistently outperform single-sided structures across the referral marketing literature, with some studies reporting participation lifts in the range of 25 to 30%. Tiered rewards, where users unlock escalating benefits as they refer more people, tend to produce even more sustained referral activity than flat reward programs because they give users a reason to keep going after the first invite. Leaderboards showing top referrers add a social motivation layer that works particularly well in community-oriented products. The common thread across all these approaches is that they give users a reason to send a second and third invitation rather than stopping at one.
Improve invite conversion rate
On the invite conversion side, simplicity is the most impactful lever. Referral programs with clear, straightforward mechanics consistently outperform complex programs with confusing rules or multi-step processes, the friction between “I want to invite someone” and “I have sent the invite” is where most participation dies. Frictionless sharing (one-click links, pre-filled messages, mobile-native share flows) reduces that friction at the mechanical level. Well-written invite messages and emails also matter; see these user invitation email best practices for examples and templates that improve conversion.
Contextual prompts at peak satisfaction moments address it at the motivational level. Triggering an invite prompt right after a user completes a key action or hits a personal milestone outperforms generic “invite a friend” banners shown at random, because the user’s enthusiasm for the product is highest at that moment. The point is not to add more features to your referral program but to remove everything that makes inviting feel like effort. Every additional step or decision you ask of the user before they can send an invite is a place where they stop.
Start measuring before you start optimizing
The virality K factor gives you a clear, calculable answer to whether your product grows itself: invites sent per user multiplied by invite conversion rate. K above 1 means the amplification factor is self-sustaining. K below 1 means you still have work to do, but you now know which of the two inputs to target first. Real companies like Dropbox used this framework deliberately, and the benchmarks show that even K = 0.3 is meaningful if you are improving it systematically and pairing it with strong retention.
Measure your virality K factor alongside retention, viral cycle time, and LTV, and you have the foundation of a real growth strategy rather than a collection of disconnected acquisition tactics. Pick one input, improve it, and track what moves. Growth is less mysterious than it looks once you are reading the right numbers.
If this is the kind of practical, jargon-free framework you want in your inbox every week, CasualMBA publishes exactly this for founders and builders who are serious about understanding how growth actually works. No textbook theory, no filler: just the frameworks that matter, explained through companies you already know.